Quick tutorial:
- Browse the .mat file you want to open. (put it into /data folder)
- Choose either Load (fast) or Load (Presets)
-
Load(fast):
- will load ONLY the name of all saved data in your .mat file
- select data you want to plot in custom subplots -> select data (left side)
- all features will work for this option
- for customizing look under the next chapter
-
Load (Presets)
- will load a pre configured set of data in your .mat file (takes a bit of time)
- choose a preset and a season, then press "Plot Presets" -> will plot pre configured graphs
- all features in "Custom Subplots" do NOT work with this
- the idea is that only sortdata.m and the plot_settings need to be configured each season
- for customizing look under the next chapter (only features within Set Timestamps panel work)
-
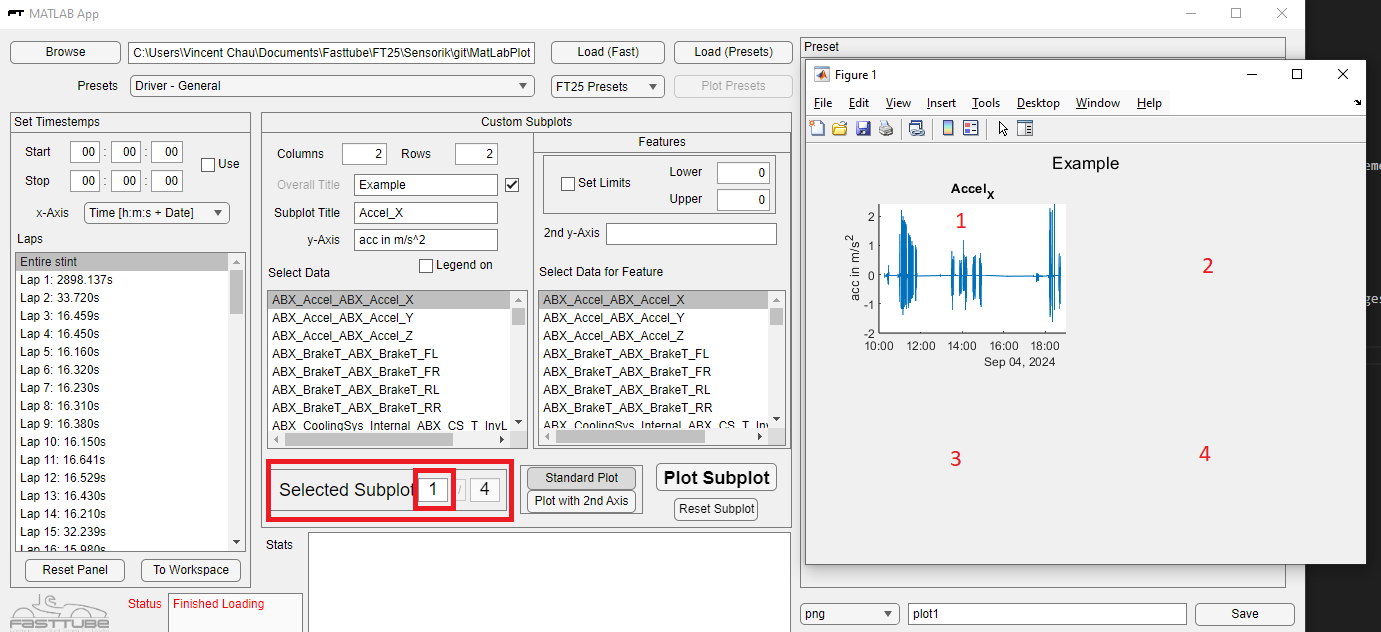
Features:
- Set Timestamps:
- works for both
- entire stint (all data recorded) is the default option that will be plotted
- otherwise you can select either the detected laps (will plot, but laps might be inaccurately recorded) or custom timestamps (remember to tick the Use box)
- Reset Panel and To Workspace Buttons:
- work only for Presets
- should something not work try pressing reset and plot preset again
- to workspace throws the entire preset dataset into the matlab workspace (for further manipulation)
- currently limited in capabilites
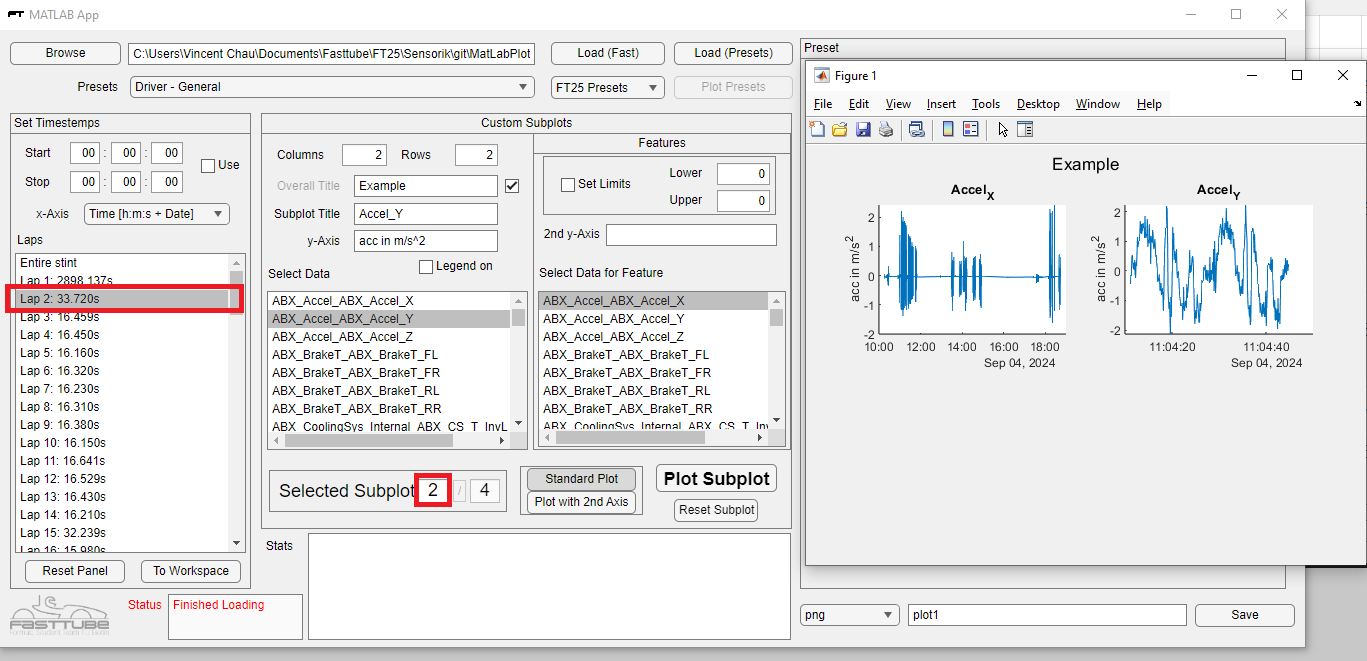
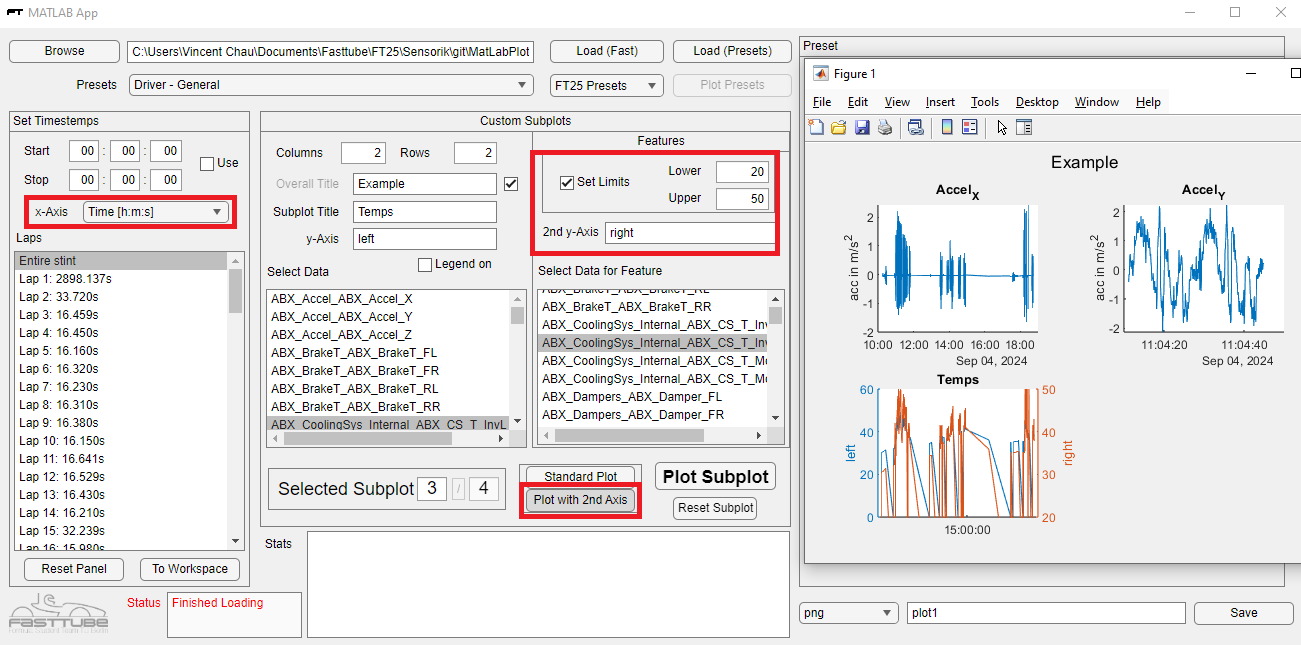
- Custom Subplots:
- only works for the selected data (if you press load preset you can also use the displayed data, but somethings like cell voltages might not be avaible)
- columns and rows to set the number of plots you want in one figure
- how it works:
- press reset subplot to delete the selected graph


not working:
- x Axis might not be avaible for everything